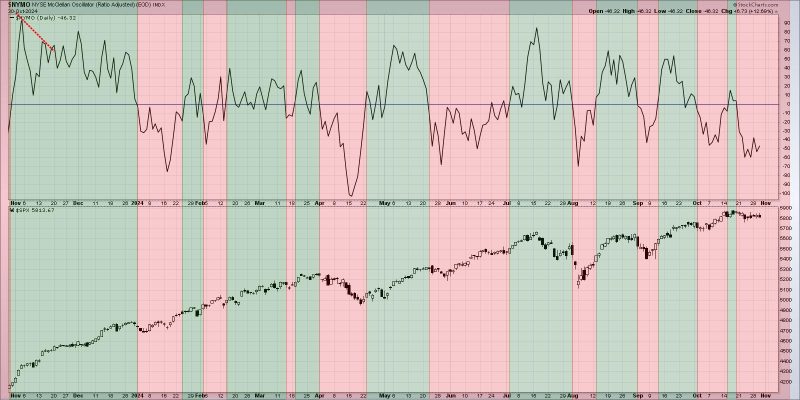
In the world of financial markets, traders and analysts often rely on a variety of indicators and signals to make informed decisions about the direction of a particular asset or market trend. One such indicator that has gained increasing attention in recent times is breadth divergences. Breadth divergences refer to situations where the breadth of market participation fails to confirm the price movement of an asset or index, leading to potential signals of underlying weakness or strength in the market.
A breadth divergence occurs when the number of stocks participating in a particular market move diverges from the overall trend of the market index. For example, if a stock index is making new highs, but a smaller number of individual stocks within that index are also making new highs, this would be considered a negative breadth divergence. On the other hand, if a stock index is declining, but a large number of individual stocks are still making new highs, this would be a positive breadth divergence.
One of the key reasons why breadth divergences have become a topic of interest among market participants is their potential to signal the end of a prevailing market trend. In bullish markets, negative breadth divergences can indicate that the market rally is losing steam, as fewer stocks are participating in the upward move. This divergence between the index and individual stock performance could suggest that market breadth is weakening, and a broader-based correction or reversal may be on the horizon.
Conversely, in bearish markets, positive breadth divergences can signal underlying strength in the market, even as the index continues to decline. This scenario may indicate that a significant number of stocks are still performing well, despite the overall negative sentiment in the market. In such cases, a positive breadth divergence could serve as a potential early signal that the market may be approaching a bottom and could be poised for a reversal.
While breadth divergences can provide valuable insights into market dynamics, it is important to note that they are not infallible indicators. Like any technical analysis tool, breadth divergences should be used in conjunction with other forms of analysis and confirmation signals to make well-informed trading decisions.
In conclusion, breadth divergences offer a unique perspective on market behavior by highlighting the participation of individual stocks in a broader market trend. By paying attention to these divergences, traders and investors can potentially gain insights into the strength or weakness of a market trend and be better prepared to navigate changing market conditions.


