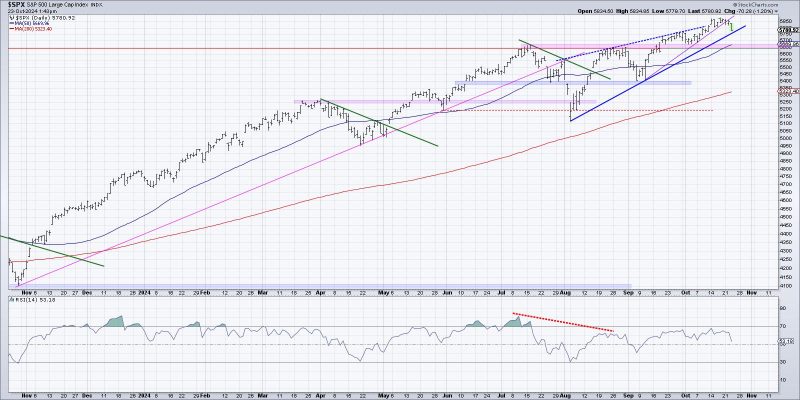
With the financial markets constantly in a state of flux, investors are always on the lookout for ways to better understand and anticipate market movements. One key concept that traders need to be familiar with is the distribution phase, which can provide valuable insights into the future direction of a stock or market. In this article, we will explore three different ways to visualize the start of a potential distribution phase.
Volume Profile
One effective way to visualize the start of a distribution phase is by using the volume profile indicator. This tool provides a graphical representation of the volume traded at each price level over a specific period of time. In the context of a potential distribution phase, investors can look for a shift in the volume profile, such as a decrease in trading activity at higher price levels or an increase in volume at lower levels. These changes can indicate a shift in market sentiment and the beginning of distribution by institutional investors.
Relative Strength Index (RSI)
Another useful tool for visualizing the start of a potential distribution phase is the Relative Strength Index (RSI). The RSI is a momentum oscillator that measures the speed and change of price movements. In the context of distribution, investors can look for divergence between the RSI and the price chart. If the price is making new highs while the RSI is failing to confirm those highs, it could be a sign that distribution is beginning. This divergence suggests that buying pressure is weakening, potentially leading to a shift in market dynamics.
Price Action Patterns
Price action patterns can also provide valuable insights into the start of a distribution phase. Traders can look for specific price patterns, such as head and shoulders formations, double tops, or triple tops, which may indicate that the market is reaching a turning point. These patterns signal that buying interest is waning, and that sellers may be starting to take control. By recognizing these patterns early on, investors can prepare for potential distribution and adjust their trading strategies accordingly.
In conclusion, visualizing the start of a potential distribution phase is crucial for investors looking to stay ahead of market trends and make informed decisions. By using tools such as the volume profile indicator, Relative Strength Index, and price action patterns, traders can better understand market dynamics and anticipate potential distribution phases. By remaining vigilant and actively monitoring these visual cues, investors can position themselves more strategically in the ever-changing financial landscape.


