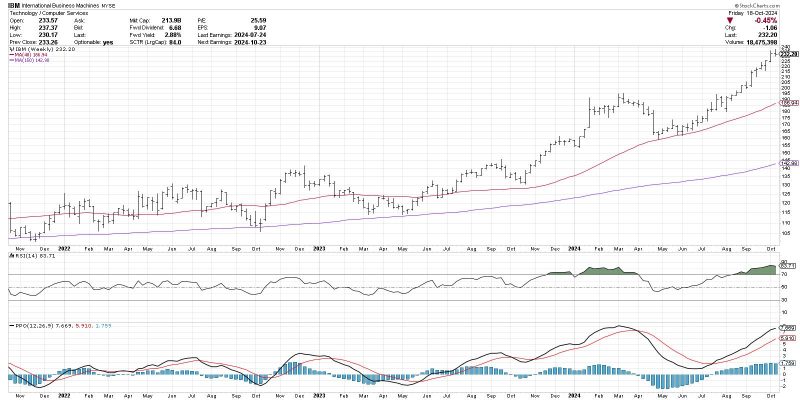
The Moving Average Convergence Divergence (MACD) histogram is a popular tool used in technical analysis to identify potential changes in trends. By providing a visual representation of the difference between the MACD line and the signal line, the histogram can offer insights into momentum shifts in the market. Traders and analysts often look to the MACD histogram for signals that could help them anticipate trend changes and make informed trading decisions.
One key aspect of the MACD histogram is its ability to provide early warnings of potential trend reversals. When the histogram starts to converge towards the zero line from above or below, it signals a slowdown in the current trend. This convergence indicates that the difference between the MACD line and the signal line is decreasing, suggesting a potential weakening of momentum. Traders interpret this as a sign that a trend change may be on the horizon, prompting them to prepare for a possible shift in market direction.
Moreover, the MACD histogram can also be used to confirm trend changes that have already begun. When the histogram crosses above or below the zero line, it indicates a change in momentum direction. A histogram crossing above zero implies a shift from bearish to bullish momentum, while a histogram crossing below zero suggests a transition from bullish to bearish momentum. Traders watch for these crossovers as confirmation of trend changes, using them to validate their trading strategies and adjust their positions accordingly.
In addition to signaling potential trend changes, the MACD histogram can also help traders identify divergences between the indicator and price action. Divergences occur when the MACD histogram moves in the opposite direction of price movements, indicating a potential reversal in the current trend. Bullish divergences occur when prices are making lower lows while the MACD histogram is making higher lows, signaling a possible upcoming bullish trend. Conversely, bearish divergences occur when prices are making higher highs while the MACD histogram is making lower highs, suggesting a potential bearish trend reversal. Traders pay close attention to these divergences as they can provide valuable insights into market dynamics and help anticipate trend changes.
Overall, the MACD histogram serves as a powerful tool for traders looking to anticipate trend changes and make informed decisions in the market. By monitoring convergence patterns, zero line crossovers, and divergences, traders can gain valuable insights into momentum shifts and potential reversals in market trends. While no indicator is foolproof, incorporating the MACD histogram into a comprehensive trading strategy can enhance decision-making processes and improve overall trading performance.


