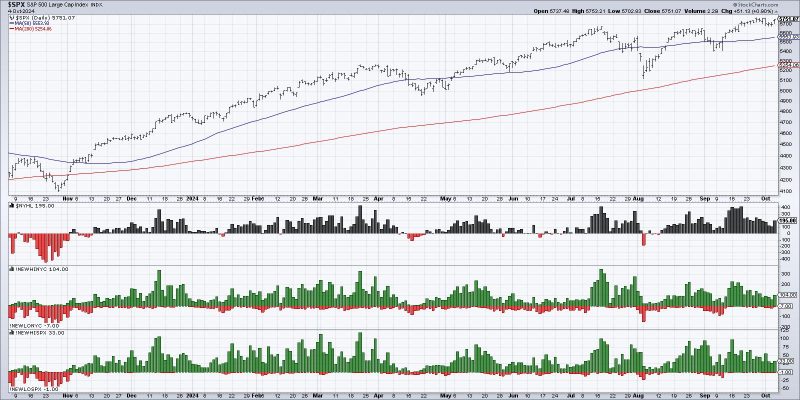
In the world of investing, especially in the stock market, one term that frequently pops up in discussions is market breadth. Market breadth essentially refers to the number of stocks advancing versus declining within a particular market index.
Understanding market breadth is crucial for investors because it provides insights into the overall health of the market. A market with good breadth implies that a large number of stocks are participating in the current trend, indicating broad market strength. Conversely, poor breadth suggests that only a select few stocks are driving the market higher, which can be concerning.
When analyzing market breadth, there are several key indicators that investors look at to gauge the market’s health. One widely used metric is the Advance-Decline Line, which tracks the number of advancing stocks minus the number of declining stocks over a specified period. A rising A-D line indicates positive market breadth, while a declining line could signal weakening breadth.
Additionally, market breadth can be assessed through indices such as the NYSE Common Stock Only Advance-Decline Line and the NYSE High-Low Index. These indices provide a deeper dive into market breadth by focusing on specific aspects of stock performance.
So, does the market have bad breadth? This question is not always straightforward to answer and often requires a nuanced understanding of various market indicators. A market exhibiting poor breadth could be a red flag for investors, indicating that the rally may be narrow and unsustainable. On the other hand, strong market breadth suggests a healthy and robust market environment, where a broad array of stocks are participating in the uptrend.
In conclusion, monitoring market breadth is an essential aspect of investment analysis, as it helps investors assess the overall health and sustainability of market trends. By keeping a close eye on market breadth indicators, investors can make more informed decisions and adapt their strategies accordingly.


