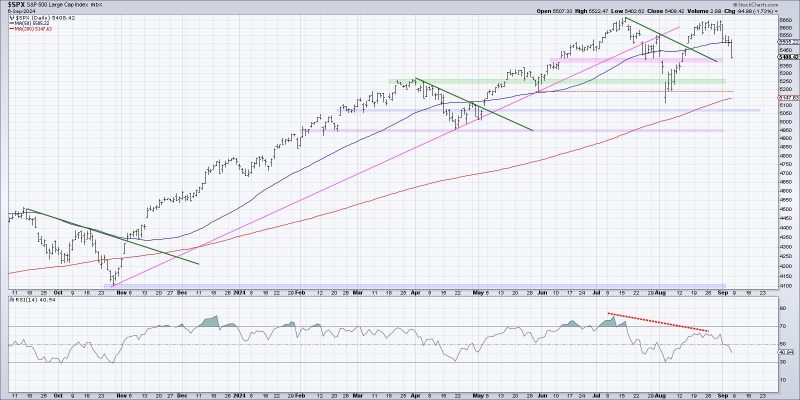
Charting the Path to Identifying Market Tops
Chart analysis has long been a valuable tool for investors and traders alike to understand market trends and make informed decisions. When it comes to identifying market tops, three specific types of charts can be particularly useful: the Relative Strength Index (RSI), the Moving Average Convergence Divergence (MACD), and the Advance-Decline Line.
The Relative Strength Index (RSI) is a momentum oscillator that measures the speed and change of price movements. When analyzing market tops, investors can look for high RSI levels above 70, indicating that a stock or index may be overbought and due for a correction. Additionally, if the RSI fails to make new highs along with the price, it could signal a bearish divergence, suggesting a potential market top.
Moving Average Convergence Divergence (MACD) is another popular charting tool that helps to identify changes in a trend’s strength, direction, and duration. In the context of market tops, traders often observe the MACD crossing below its signal line, signaling a potential shift from bullish to bearish momentum. Such crossovers can serve as early warnings of an impending market top and may prompt investors to adjust their positions accordingly.
The Advance-Decline Line is a breadth indicator that measures the number of advancing and declining stocks in a stock market index. A rising Advance-Decline Line confirms the underlying strength of a bull market, while a declining line may indicate waning market breadth, potentially foreshadowing a market top. By monitoring the divergence between the stock market index and the Advance-Decline Line, investors can gain insights into the overall health of the market and identify potential turning points.
In conclusion, while no indicator or chart can predict market behavior with absolute certainty, the Relative Strength Index, Moving Average Convergence Divergence, and Advance-Decline Line offer valuable insights into market conditions and can help investors identify potential market tops. By combining these charting tools with thorough analysis and risk management strategies, investors can enhance their decision-making process and navigate the complexities of the financial markets with greater confidence.


